Think of a car test in a magazine. Every car drives the same track, uses the same fuel, and gets a number for speed and one for fuel use. The numbers help you compare. They do not tell you how the car handles your daily drive with two kids and a trailer.
A benchmark is that test for AI models. It is a fixed set of tasks, the same for every model, with a way to check each answer. The result is a score, often a percentage of tasks solved. Many benchmarks now also measure the cost: how much money it took to run the whole test. Put many benchmarks side by side and you get a leaderboard: a ranked list of models.
Some tests are close to office work (write a report, fill a spreadsheet), some are exam questions, some are coding tasks run inside an agent like Claude Code. The same model can score very differently on each.
Where to see who leads right now
These sites are kept up to date and show charts you can read without being a programmer. All of them worked on 23 September 2026.
| Site | Who runs it | What it measures | Start here if |
|---|---|---|---|
| Artificial Analysis | Independent company | Runs the tests itself: an overall “Intelligence Index”, price, speed, cost to run. Charts of score against cost. | You want one neutral overview. The best first stop. |
| LMArena | LMArena | People compare two answers without knowing which model wrote which, and vote. | You care which answers people like. |
| Scale SEAL leaderboards | Scale AI | Private tests written by experts, so models cannot have seen them before. | You want tests that are hard to game. |
| Epoch AI Benchmarking Hub | Research nonprofit | Runs well-known tests itself and shows progress over time. | You want to see how fast models are getting better. |
| Humanity’s Last Exam | Center for AI Safety and Scale AI | Very hard expert questions from many fields. | You want to know where the limit is today. |
| DeepSWE | Datacurve | Long, real software tasks, with cost per task. | You want to see agents doing long work. |
| OpenRouter rankings | An AI marketplace | What people actually use most. Popularity, not quality. | You want to know what others pick. |
The snapshot on the Model page is one of these charts, from Artificial Analysis.
Example: effort, price and score together
A benchmark gets really useful when it shows score and cost for each effort level. Here is the independent Artificial Analysis test for the current Claude models:
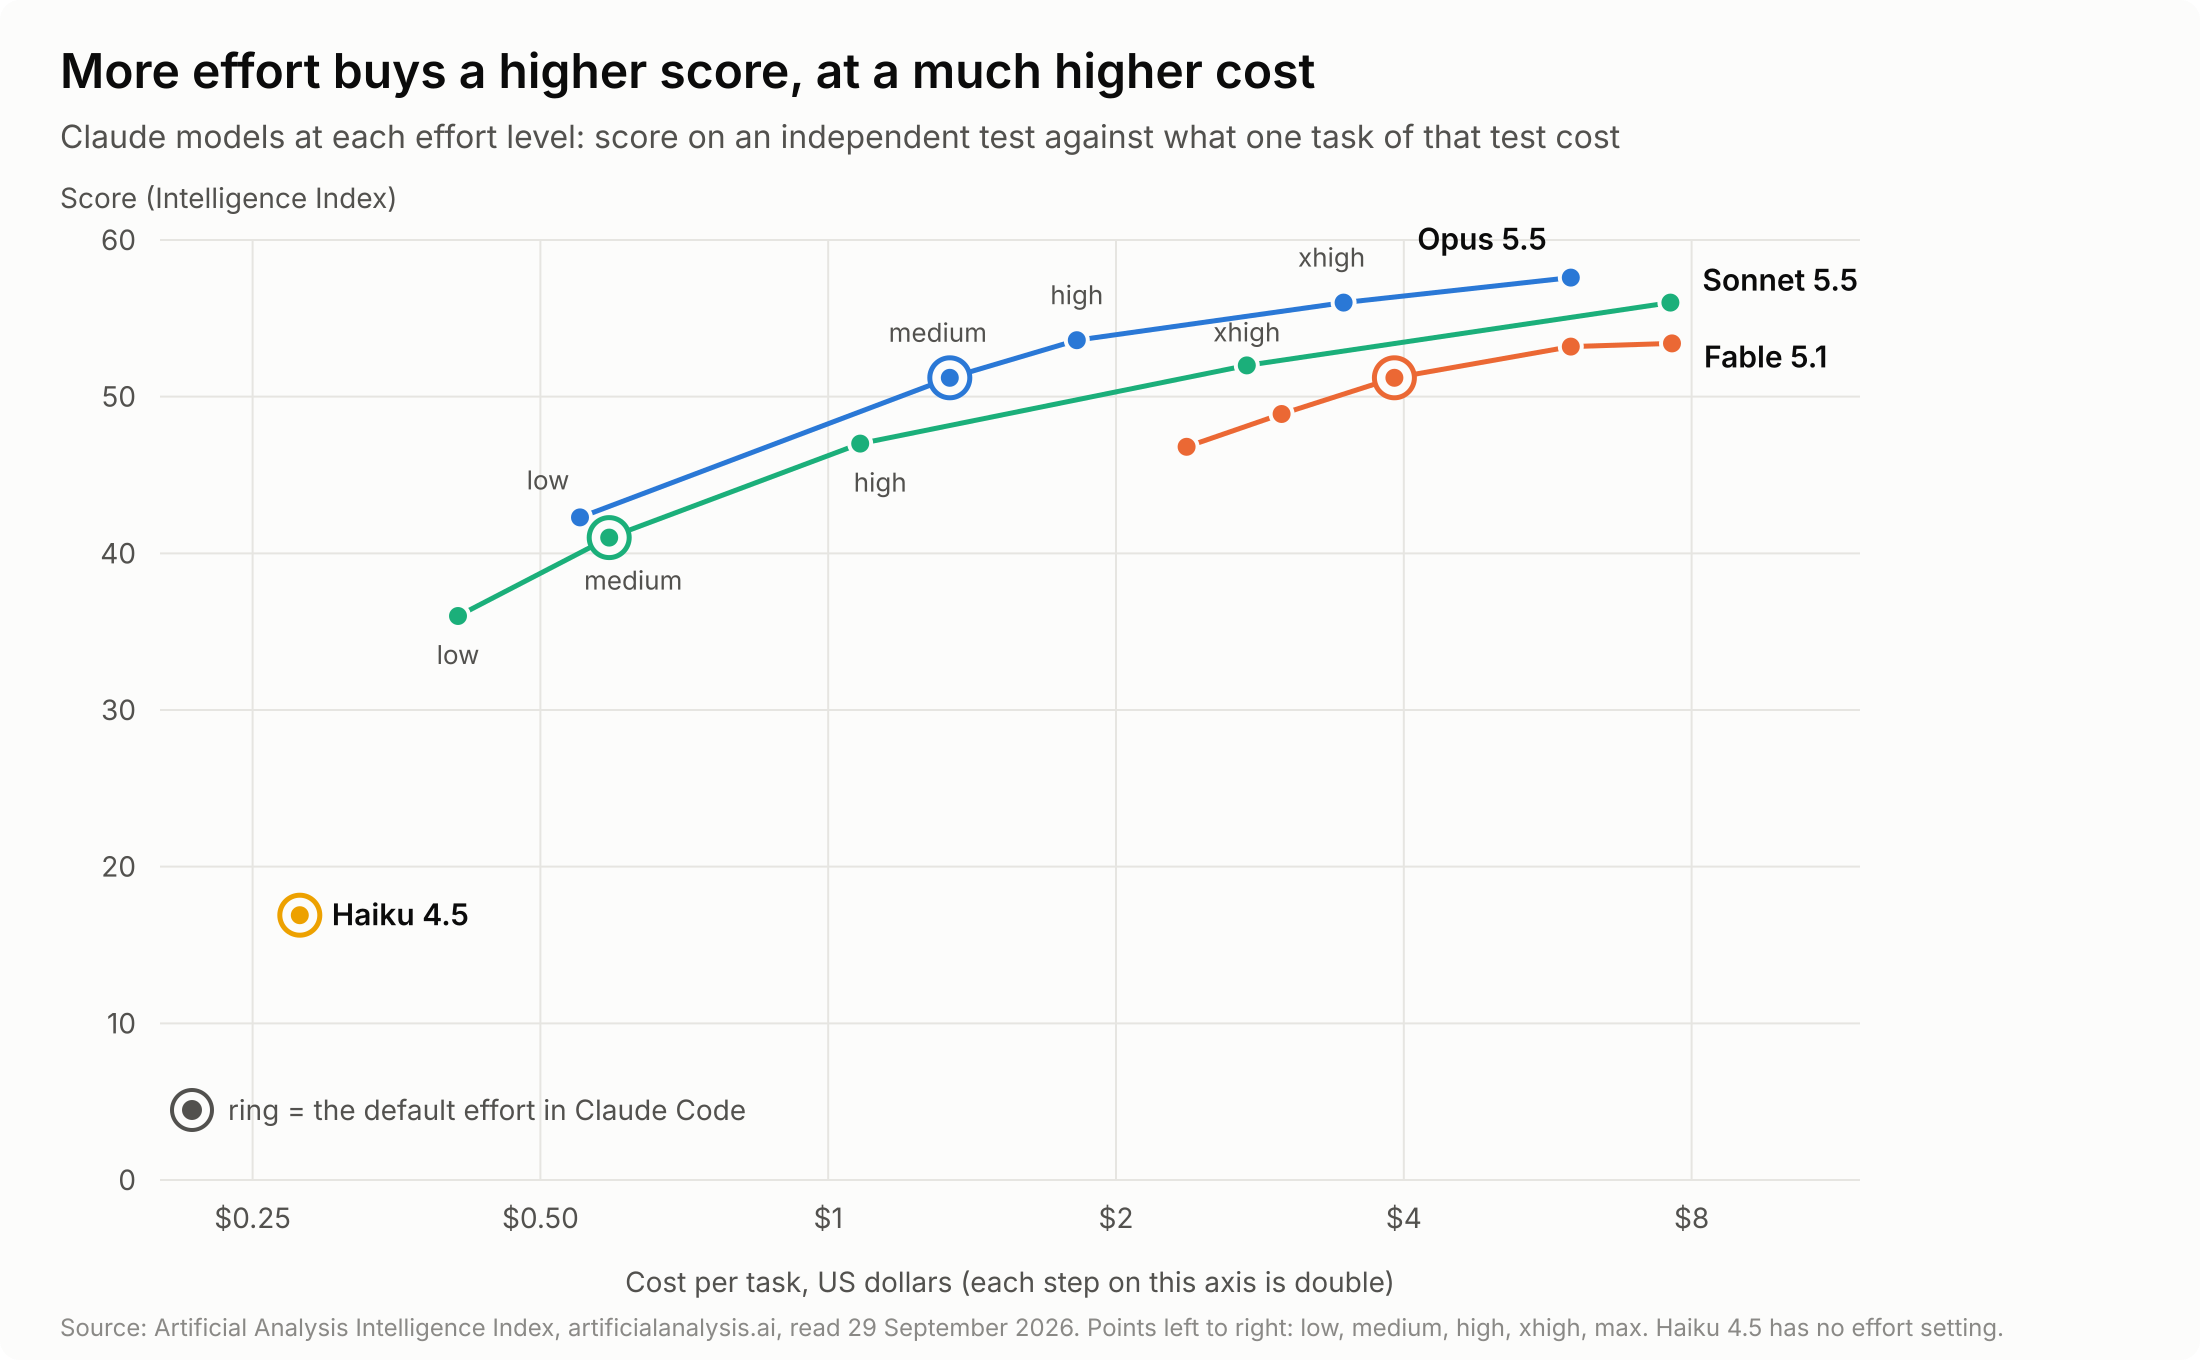
Score against cost per task for each Claude model and effort level. Chart: petr-ai-school, from Artificial Analysis data, 29 September 2026.
What you can read from it:
- More effort, more score, much more cost. Opus 5.5 from medium to max: the score goes from 51 to 58, the cost per task goes up more than four times.
- The first steps pay, the last ones rarely do. From low to medium is a big jump. From xhigh to max is small and expensive.
- The biggest model is not always the best one. Opus 5.5 at medium effort scores the same as the bigger Fable 5.1 at high, for about a third of the cost. At max effort Opus 5.5 is ahead. Only a benchmark shows you that.
Here is a similar chart from a vendor. Anthropic published this one for Opus 5 in July 2026, on the DeepSWE coding test:
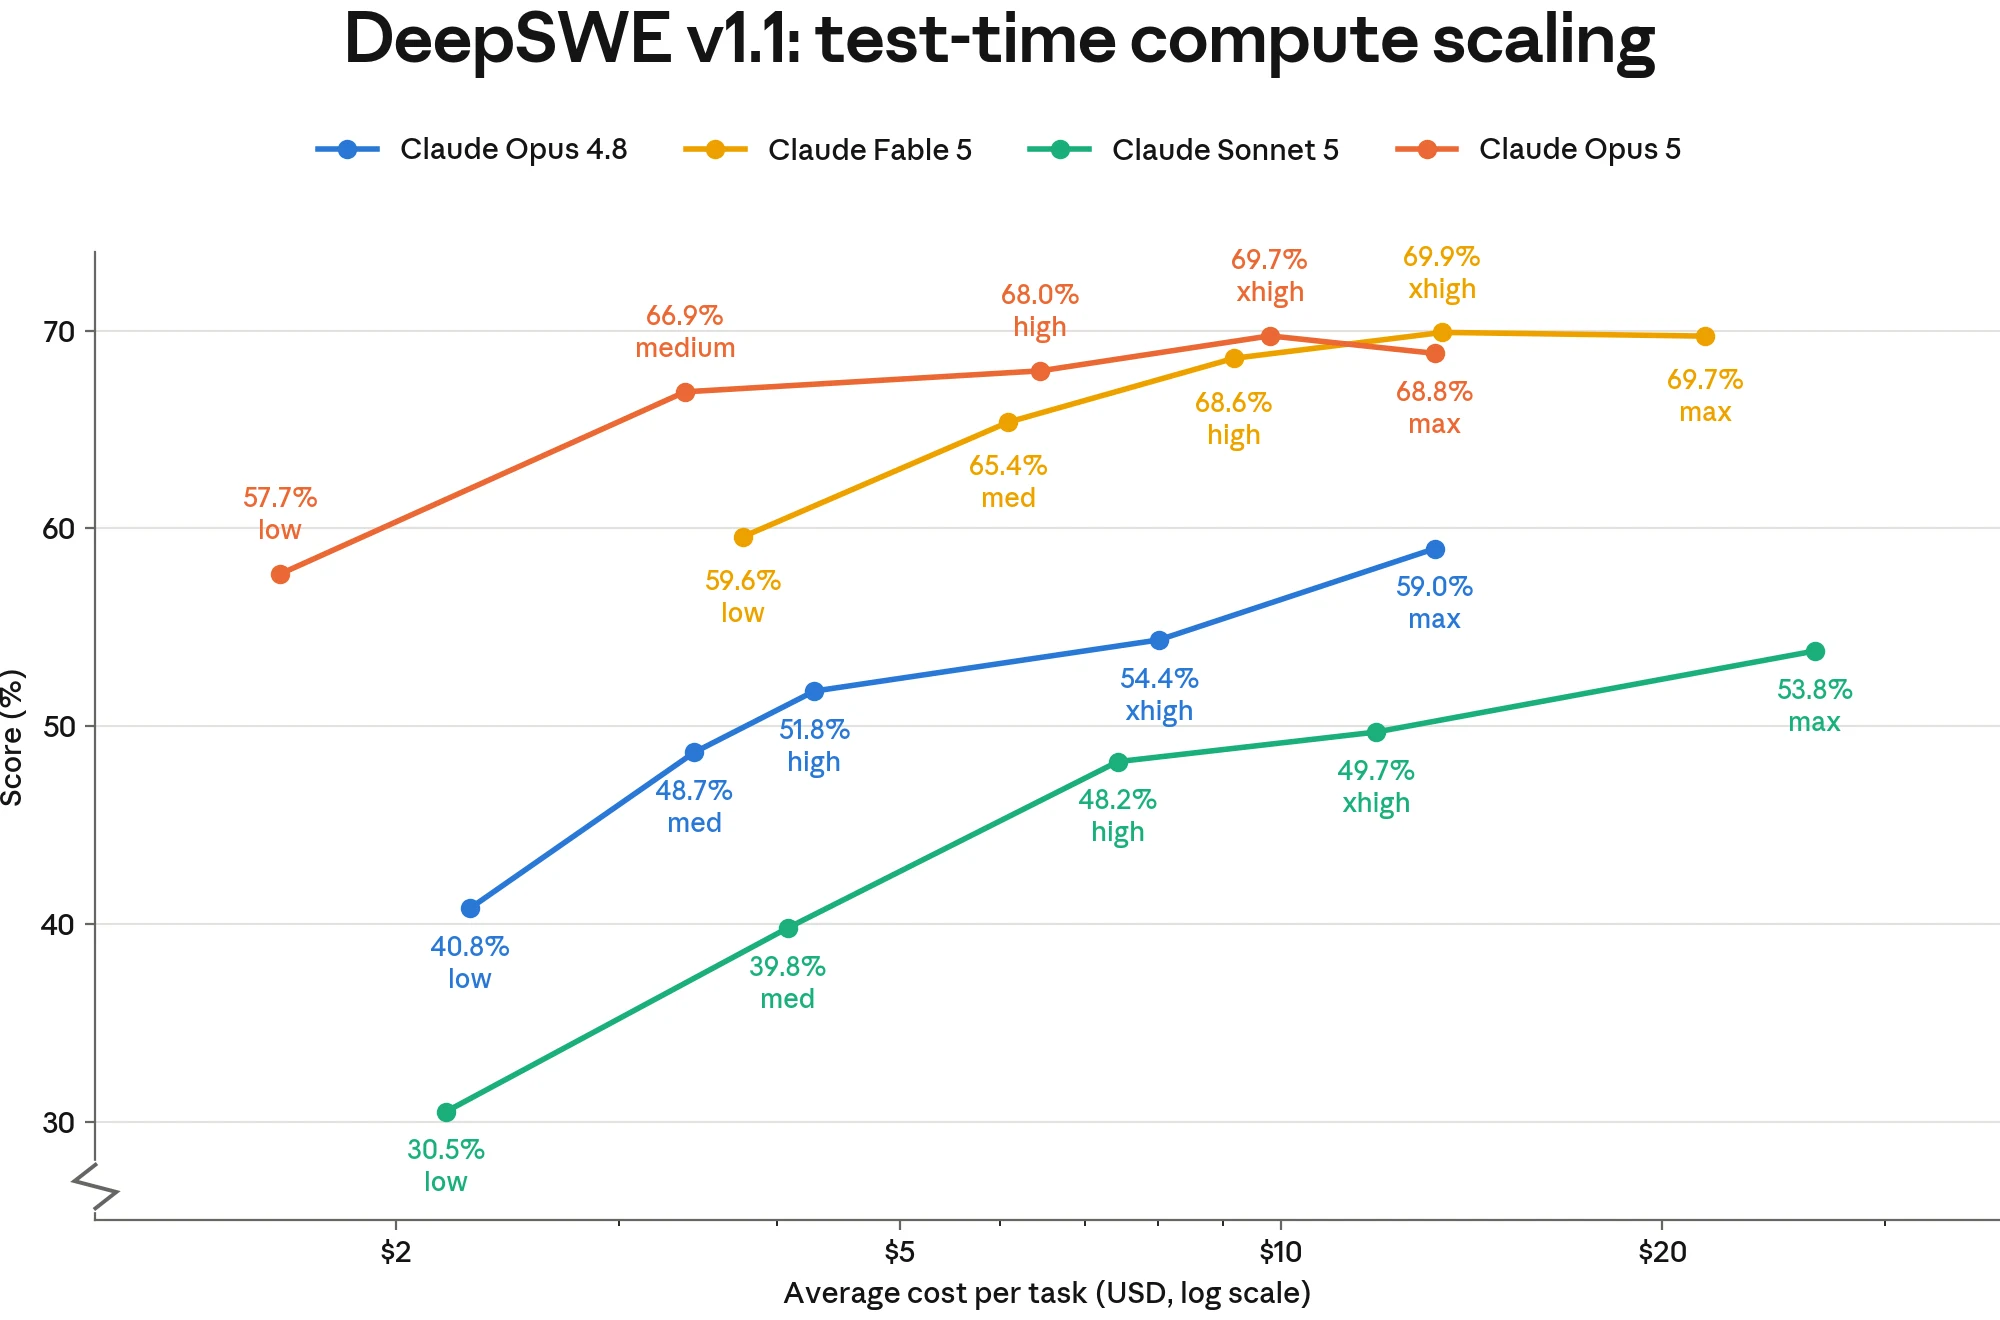
DeepSWE score against average cost per task, at each effort level. Chart: Anthropic, Claude Opus 5 System Card, July 2026.
Same shape: each step up in effort costs more and buys less. Notice the scale on the left starts at 30, not 0. That makes the gaps look bigger than they are.
How to read a benchmark without being fooled
Many people believe the model at the top of a leaderboard is the best one for them. Often it is not, for these reasons:
- Who ran the test. A company’s own launch charts pick the tests and settings that suit it. For the same model and test, Anthropic reported 68.8% on DeepSWE and Datacurve, who made the test, measured 74%. Prefer independent sites.
- The setting matters. The same model scores differently at different effort levels and in different programs around it (see Harness). One number hides this.
- Models may have seen the answers. Many tests are built from public material that is also in the training data. An audit in 2026 found models finding the official solutions inside a coding test’s own files.
- The test can be too easy. When the top models all score above 90%, the test no longer tells them apart.
- The axis may not start at zero. Small differences then look large. Check the numbers, not the height of the line.
- Cost per what? Per task, per attempt, per whole test, estimated or measured. Read the small print before you compare two charts.
Why it matters for you
A benchmark tells you which models are at the front, and roughly what each step up in effort or tier costs. That is enough to have an opinion when a colleague says “you have to switch to model X”. It is not enough to choose for your work. For that, try two models on one real task of yours and compare the results. That is the only test that measures your job.
Sources
- Anthropic: Claude Opus 5 System Card (DeepSWE chart, figure 8.3.A), Models overview
- Artificial Analysis Intelligence Index, read 23 September 2026
- DeepSWE leaderboard, Datacurve
- VentureBeat: DeepSWE blows up the AI coding leaderboard, May 2026
Related
- Model - what is being tested, and who makes them
- Claude model family - the tiers these charts compare
- Effort - the dial along each line in the chart
- Token - what the cost is made of
- Verification - checking claims, including benchmark claims